
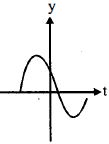
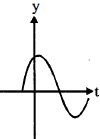
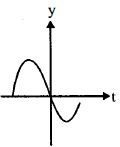
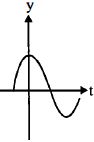
The displacement $y(t) = A \sin (\omega t + \phi)$ of a pendulum for $\phi = \frac{2\pi}{3}$ is correctly represented by which of the following graphs?
- A
- B
- C
- D
Explore More
Similar Questions
Two bodies performing $SHM$ have the same amplitude and frequency. Their positions at a certain instant are as shown in the figure. The phase difference between them is
The displacement of a simple harmonic oscillator after $3 \; s$ starting from its mean position is equal to half of its amplitude. The time period of the harmonic motion is $\dots \; s$.
$A$ particle performs simple harmonic motion with a period of $2 \ s$. The time taken by the particle to cover a displacement equal to half of its amplitude from the mean position is $\frac{1}{a} \ s$. The value of $a$ to the nearest integer is:
Which of the following curves represents correctly the oscillation given by $y = y_0 \sin(\omega t - \phi)$,where $0 < \phi < 90^\circ$?
Medium
View SolutionDistance travelled by a particle in $\text{SHM}$ when its phase changes from $\frac{\pi}{6}$ to $\frac{5 \pi}{6}$ is:
Medium
View SolutionVedclass Products
For Students
Vedclass Test Series
Mock tests in real JEE/NEET style with performance analysis. 5-day free trial.
Start Free TrialFor Teachers
Exam Paper Generator
Generate Set A/B/C/D exam papers from 7.5L+ questions in 2 minutes. 3 chapters free.
Try FreeFor Institutes
Online Exam Module
Live online exams with unlimited students, 360° analytics & white-label branding.
See Demo